The pointdexter package labels longitudinal and latitudinal coordinates located inside a polygon.
Description
For a singular polygon, the label for each coordinate pair is a logical vector of TRUE and FALSE values. For multiple polygons, the label for each coordinate pair is a character vector based on the names of each polygon.
Spatial Packages
The package is designed to work with both sf and SpatialPolygonsDataFrame objects.
By default, pointdexter only installs and loads the sp and splancs packages.
However, pointdexter also works with the sf package. The following is sf installation advice from Matt Herman:
Depending on your operating system and available libraries,
sfcan be tricky to install the first time. Thesfwebsite is a good place to start if you’re having trouble. If you’re using macOS, this is a good guide to installing the required libraries.
Installation
The latest stable release version can be installed from CRAN:
install.packages("pointdexter")Development versions can be installed from GitHub:
# note: by default, the development version is the master branch;
#       however, that can be changed by changing the
#       value in the 'ref' argument
remotes::install_github("cenuno/pointdexter")
Usage
Build-in Data
pointdexter comes with built-in point and polygon data - entirely due to the awesome and accessible Chicago Data Portal - to help you label points in polygons:
- Chicago Public Schools (CPS) - School Profile Information, School Year (SY) 2018-2019
- as a data frame
- City of Chicago boundary
- as a SpatialPolygonsDataFrame; and
- as a simple feature
- Chicago’s 77 community areas
- as a SpatialPolygonsDataFrame; and
- as a simple feature
- Chicago’s 2010 census tracts
- as a SpatialPolygonsDataFrame; and
- as a simple feature
Example
Using built-in data, down below is an example of how to use pointdexter to label coordinate pairs with their appropriate polygon:
# load necessary packages ----
library(pointdexter) # label coordinate pairs in polygons
library(sp)          # classes and methods for spatial data
library(knitr)       # general purpose package for dynamic report generation

# load necessary data ----
data("cps_sy1819")
data("community_areas_spdf")

# create list of coordinate pair matrices for each community area ----
community.area.boundaries <-
  GetPolygonBoundaries(my.polygon = community_areas_spdf
                       , labels = community_areas_spdf$community)

# identify the community that each cps school lies in ----
cps_sy1819$community <-
  LabelPointsWithinPolygons(lng = cps_sy1819$school_longitude
                            , lat = cps_sy1819$school_latitude
                            , polygon.boundaries = community.area.boundaries)

# store relevant columns ----
relevant.columns <-
  c("school_id", "short_name"
    , "school_longitude", "school_latitude", "community")

# show first few records ----
kable(head(cps_sy1819[, relevant.columns], n = 10))| school_id | short_name | school_longitude | school_latitude | community |
|---|---|---|---|---|
| 609760 | CARVER MILITARY HS | -87.59062 | 41.65629 | RIVERDALE |
| 609780 | MARINE LEADERSHIP AT AMES HS | -87.72174 | 41.91604 | LOGAN SQUARE |
| 610304 | PHOENIX MILITARY HS | -87.68696 | 41.87912 | NEAR WEST SIDE |
| 610513 | AIR FORCE HS | -87.63276 | 41.82814 | ARMOUR SQUARE |
| 610390 | RICKOVER MILITARY HS | -87.66579 | 41.98902 | EDGEWATER |
| 609754 | CHICAGO MILITARY HS | -87.61922 | 41.83055 | DOUGLAS |
| 610132 | POE | -87.60642 | 41.70263 | PULLMAN |
| 610177 | SKINNER | -87.65942 | 41.87910 | NEAR WEST SIDE |
| 610534 | SKINNER NORTH | -87.64484 | 41.90511 | NEAR NORTH SIDE |
| 610066 | MCDADE | -87.61921 | 41.73455 | CHATHAM |
# plot only CPS high schools in the the Austin, Rogers Park, and West Elsdon community areas ----

# create filter condition ----
filter.condition <-
  which(cps_sy1819$is_high_school &
          cps_sy1819$community %in% c("AUSTIN"
                                      , "ROGERS PARK"
                                      , "WEST ELSDON"))

# filter cps records to those that matched our condition ---
df <- cps_sy1819[filter.condition, ]

# note: clear plot space
par(mar = c(0, 0, 1, 0))
plot(x = community_areas_spdf
     , main = "CPS High Schools in Austin, Rogers Park, and West Elsdon communities, SY1819"
     , cex.main = 0.75
     , col = "gray85"
     , border = "dodgerblue4")
points(x = df$school_longitude
       , y = df$school_latitude
       , pch = 19
       , col = rgb(red = 212, green = 69, blue = 0
                   , alpha = 90
                   , maxColorValue = 255)
       , cex = 1)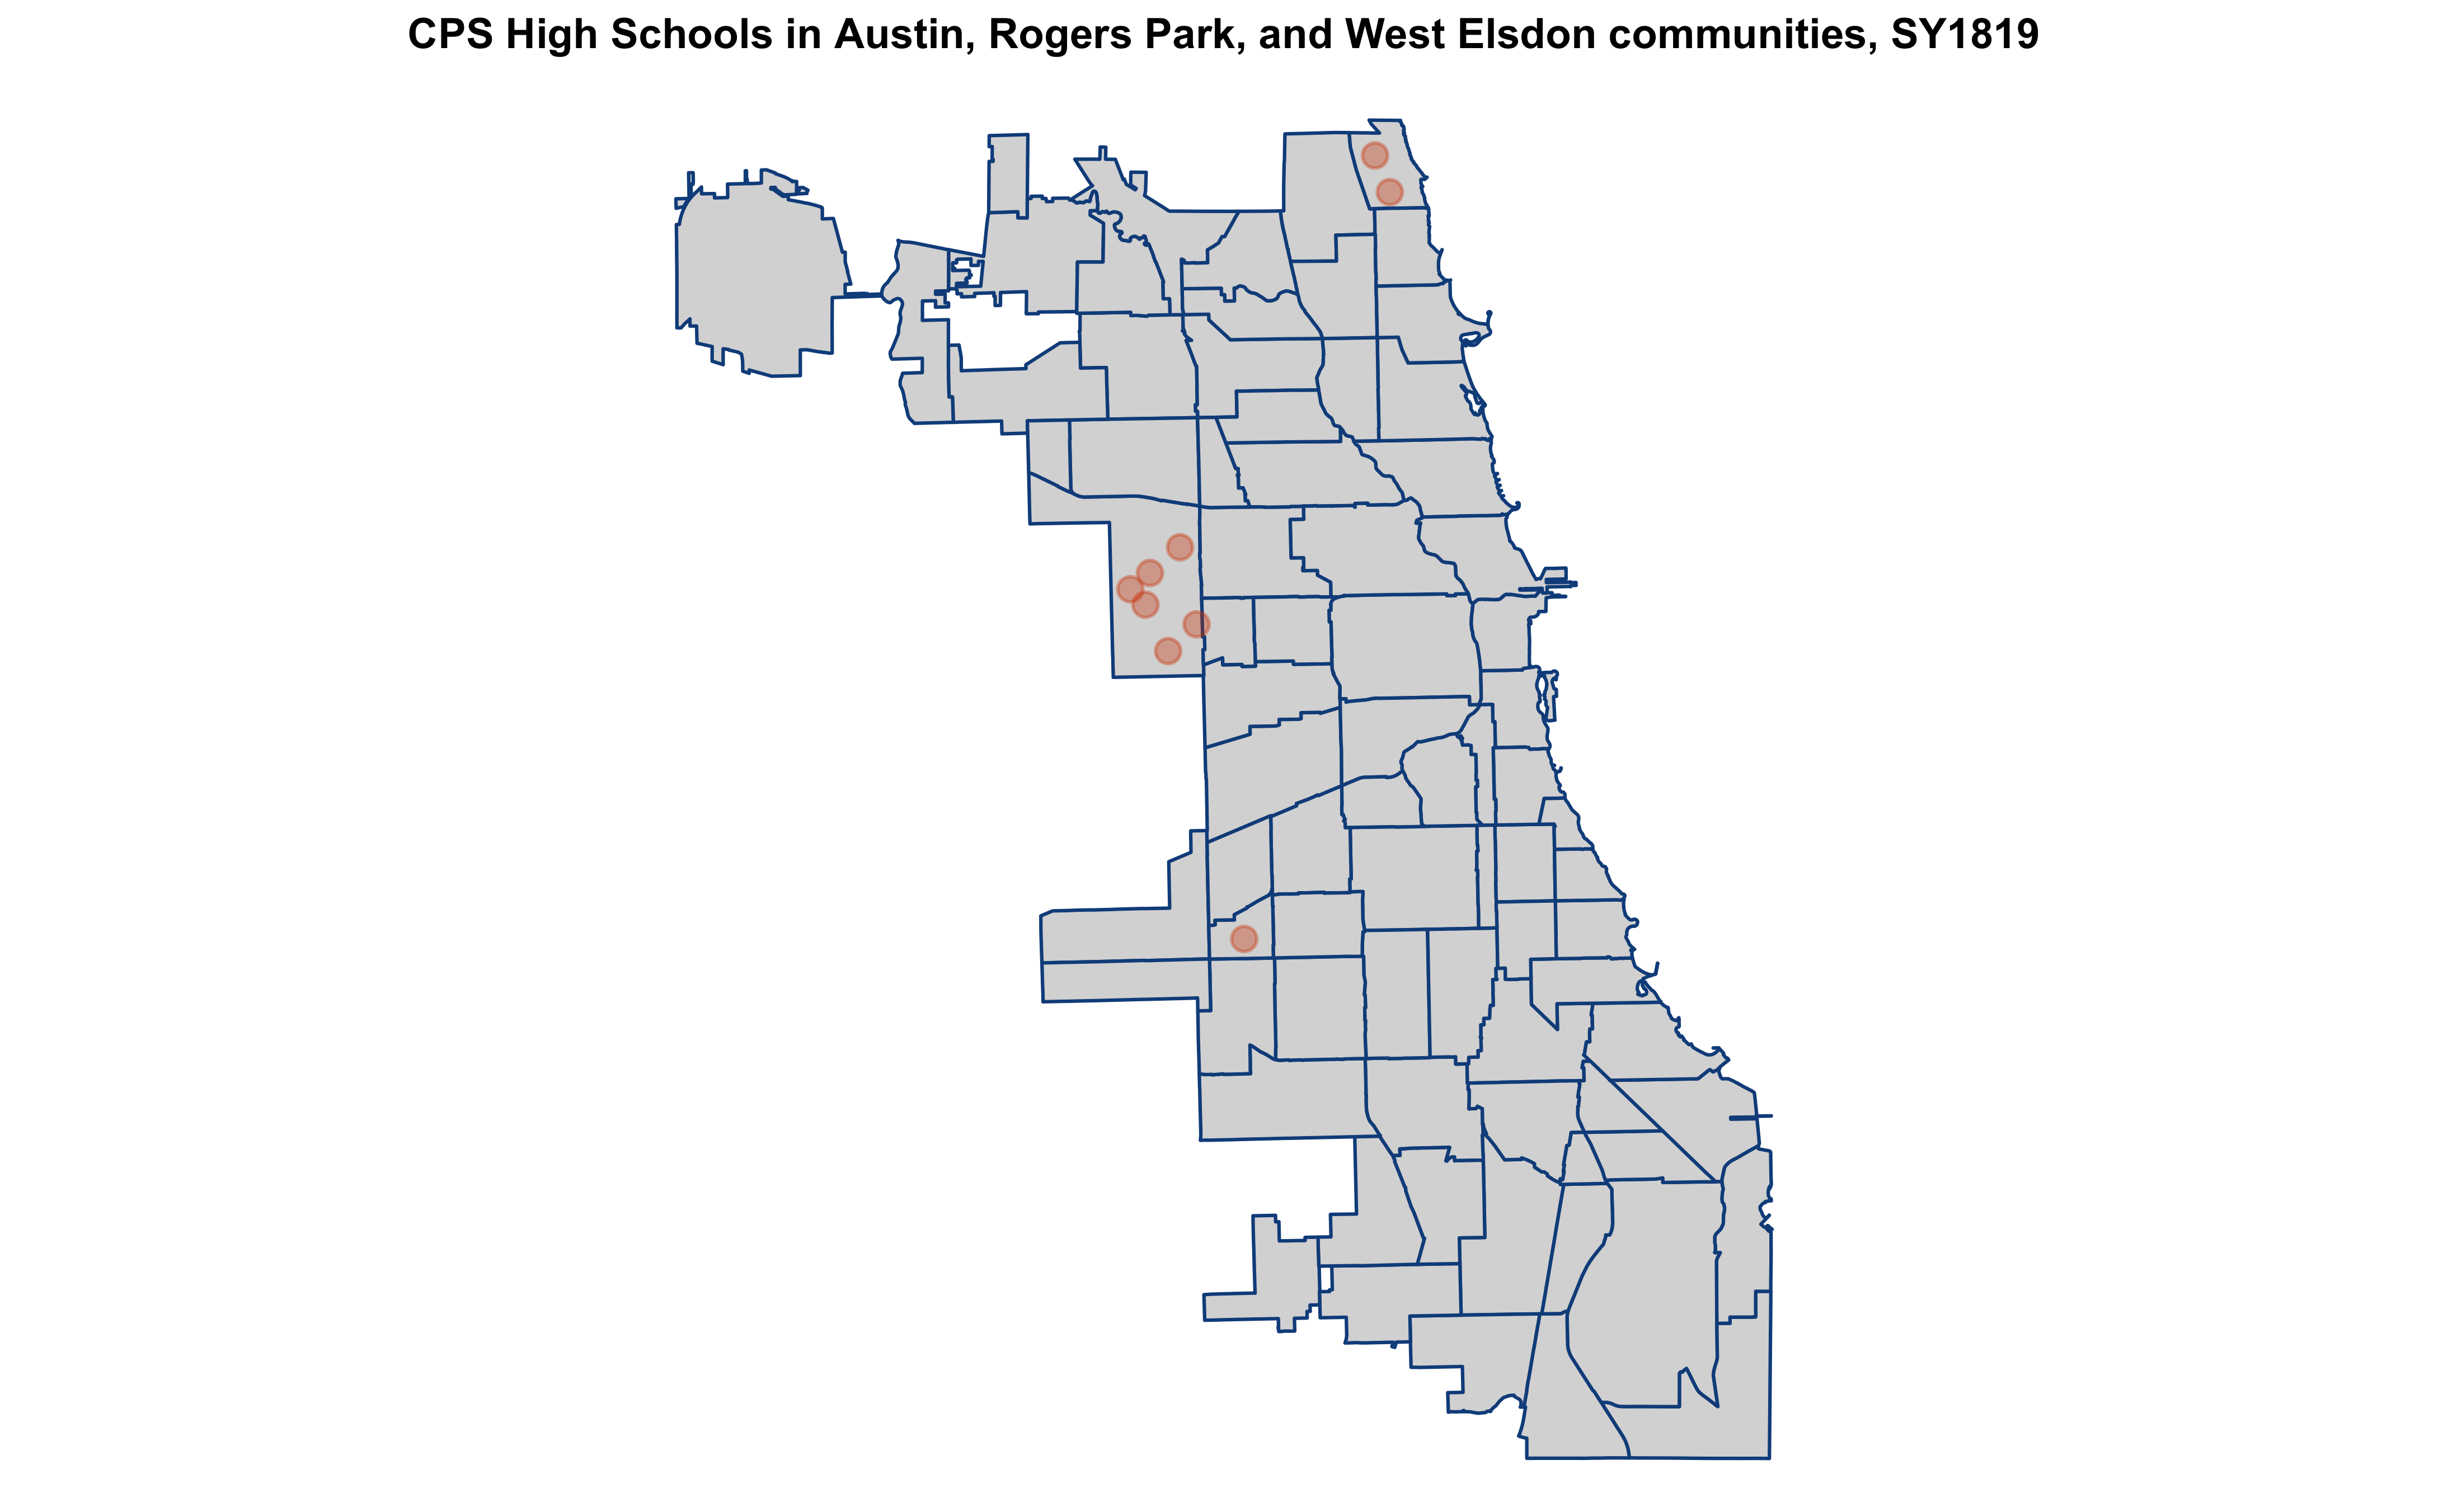
# store relevant columns ----
relevant.columns <-
  c("school_id", "short_name", "is_high_school"
    , "school_longitude", "school_latitude", "community")

# print table of those schools that met the condition ----
kable(df[order(df$community), relevant.columns], row.names = FALSE)| school_id | short_name | is_high_school | school_longitude | school_latitude | community |
|---|---|---|---|---|---|
| 400127 | YCCS - AUSTIN CAREER | TRUE | -87.76022 | 41.89498 | AUSTIN |
| 400123 | YCCS - SCHOLASTIC ACHIEVEMENT | TRUE | -87.74254 | 41.88045 | AUSTIN |
| 400144 | YCCS - WESTSIDE HOLISTIC | TRUE | -87.74881 | 41.90224 | AUSTIN |
| 610245 | DOUGLASS HS | TRUE | -87.76767 | 41.89037 | AUSTIN |
| 610244 | CLARK HS | TRUE | -87.75333 | 41.87288 | AUSTIN |
| 610518 | AUSTIN CCA HS | TRUE | -87.76192 | 41.88599 | AUSTIN |
| 400035 | CHICAGO MATH & SCIENCE HS | TRUE | -87.67482 | 42.01303 | ROGERS PARK |
| 609733 | SULLIVAN HS | TRUE | -87.66919 | 42.00269 | ROGERS PARK |
| 609694 | HANCOCK HS | TRUE | -87.72447 | 41.79146 | WEST ELSDON |
Resources
After you’ve installed the package, be sure to view the help files that introduce you to pointdexter’s two functions:
Feedback
Cite
If you use pointdexter for any analysis, I would love to hear about it! You can also cite the package according to citation("pointdexter").
Contribute
Issues and pull requests are welcome anytime!
Code of Conduct
Please note that this project is released with a Contributor Code of Conduct. By participating in this project you agree to abide by its terms.
