A simple feature of the 2010 Chicago census tracts
census_tracts_sf.RdA simple feature containing the 2010 Chicago census tracts that can only be used with the sf package.
data("census_tracts_sf")
Format
A simple feature (which is either data.frame or tibble) with a geometry list-column with 801 observations on the following 10 variables:
statefp1017, a 2-digit code from the American National Standards Institute/Federal Information Processing Standards (ANSI/FIPS) that represents the State of Illinois
name10un-padded 3-to-6 digit (excluding the decimal point) name of the census tract
commarea_nnumeric name of the community area that the census tract lays within, which can be used as a crosswalk to identify particular census tracts in a given community area
namelsad10character name of the census tract
commareanumeric name of the community area that the census tract lays within, which can be used as a crosswalk to identify particular census tracts in a given community area
geoid1011-digit code that unique identifies the census tract as a concatenation of
statefp10(2-digits) +countyfp10(3-digits) +tractce(6-digits)notesnot every census tract lays exactly within a community area which is where the City of Chicago made notes regarding instances of overlap, low population, or a census tract falling outside the City's boundaries
tractce10padded 6-digit name of the census tract
countyfp103-digit county name for Cook County
geometrya list that contains the dimensions and the simple feature geometry type
Details
The following is sf installation advice from Matt Herman:
Depending on your operating system and available libraries, sf can be tricky to install the first time. The sf website is a good place to start if you're having trouble. If you're using macOS, this is a good guide to installing the required libraries.
Source
This sf object comes from the City of Chicago Data Portal,
Boundaries - Census Tracts - 2010. The file was last updated on July 11, 2018.
References
sf documentation has helpful information on how to work with sf objects.
See also
Examples
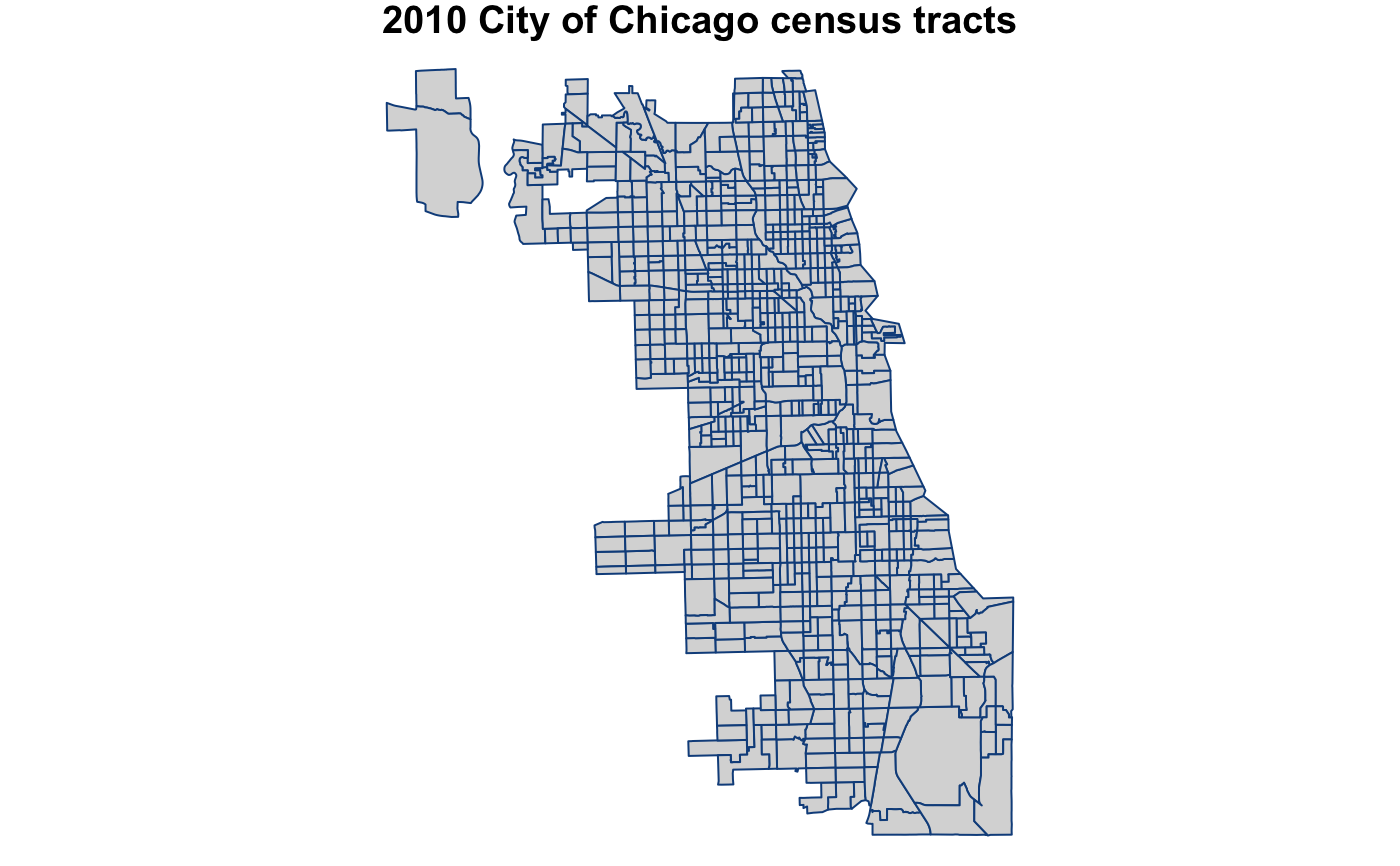
# load necessary packages ----
library(sf)

# load necessary data ----
data("census_tracts_sf")

# plot Chicago 2010 census tracts ----
par(mar = c(0, 0, 1, 0))

plot(census_tracts_sf$geometry
     , main = "2010 City of Chicago census tracts"
     , col = "gray85"
     , border = "dodgerblue4")