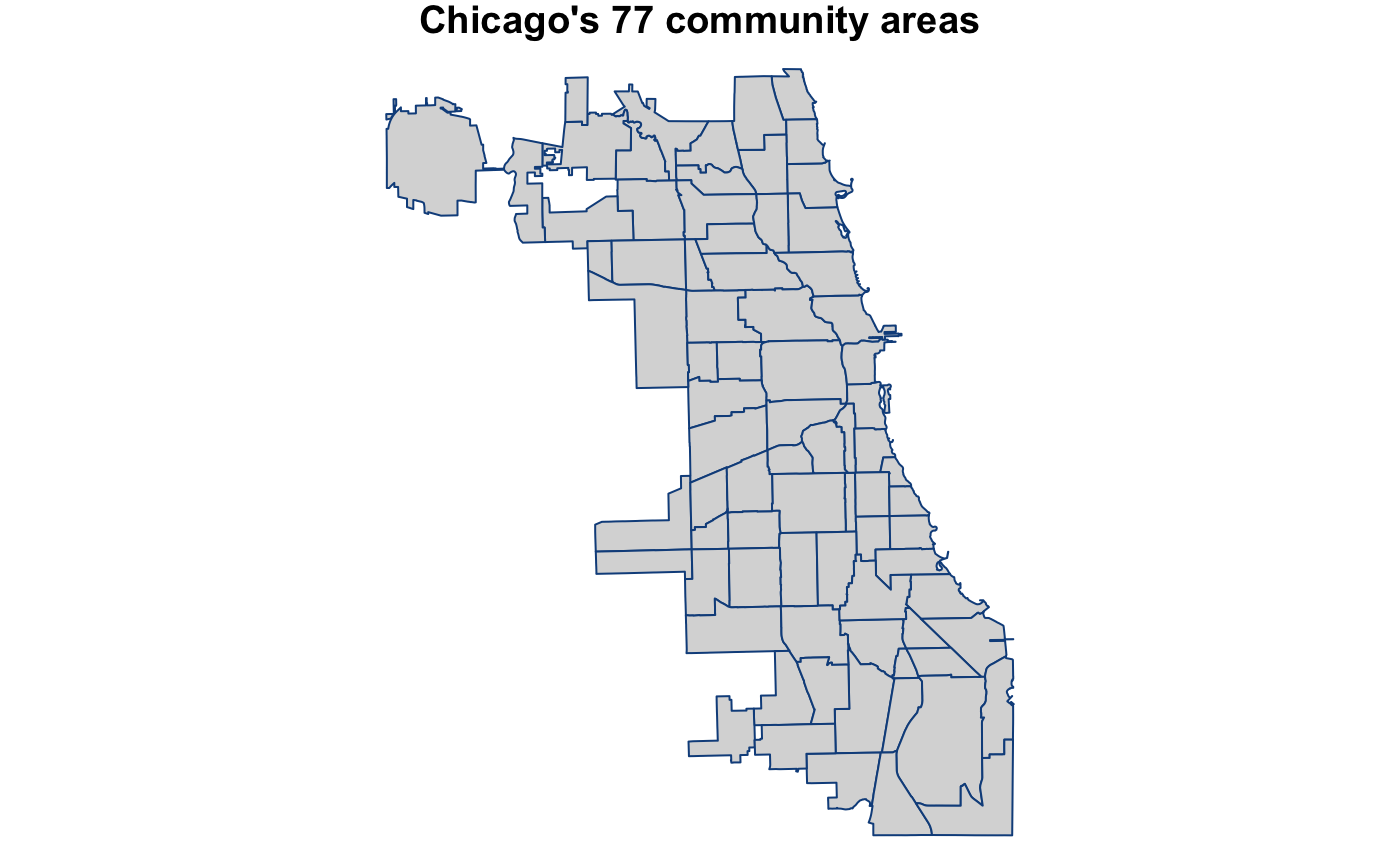
Chicago's 77 community areas
community_areas_sf.RdA simple feature of the 77 community area boundaries in Chicago that can only be used with the sf package.
data("community_areas_sf")
Format
A simple feature (which is either data.frame or tibble) with a geometry list-column with 77 observations on the following 3 variables:
communitythe name of each community area
area_numbethe area number for each community(identical to
area_num_1)geometrya list that contains the dimensions and the simple feature geometry type
Details
The following is sf installation advice from Matt Herman:
Depending on your operating system and available libraries, sf can be tricky to install the first time. The sf website is a good place to start if you're having trouble. If you're using macOS, this is a good guide to installing the required libraries.
Source
This data frame comes from the City of Chicago Data Portal, Boundaries - Community Areas (current). The file was last updated on December 18, 2018.
References
sf documentation has helpful information on how to work with sf objects.
See also
Examples
# load necessary packages ----
library(sf)

# load necessary data ----
data("community_areas_sf")

# plot all 77 community areas -----
par(mar = c(0, 0, 1, 0))

plot(community_areas_sf$geometry
     , main = "Chicago's 77 community areas"
     , col = "gray85"
     , border = "dodgerblue4")